DataFrame.style
pandas.io.formats.style.Styler
class pandas.io.formats.style.Styler(data,
                                     precision=None,
                                     table_styles=None,
                                     uuid=None,
                                     caption=None,
                                     table_attributes=None,
                                     cell_ids=True,
                                     na_rep=None)
参数:
data :Series or DataFrame
要格式化的数据
precision :int
Precision to round floats to, defaults to pd.options.display.precision.
table_styles: list-like, default None
caption :str, default None 标题
Caption to attach to the table.
table_attributes : str, default None 表格属性
。。。
Methods
apply(func[, axis, subset]) : 按列、按行或按表应用函数。applymap(func[, subset]) :按元素顺序应用函数。background_gradient([cmap, low, high, axis, …]) :用渐变样式给背景上色bar([subset, axis, color, width, align, …]) :在单元格背景中绘制条形图。format(formatter[, subset, na_rep]) : 格式化单元格的文本显示值。hide_columns(subset) :隐藏列从呈现。hide_index(): Hide any indices from rendering.highlight_max([subset, color, axis]) :通过阴影背景来突出最大值。highlight_min([subset, color, axis]):通过阴影背景突出最小值。highlight_null([null_color, subset]):为缺少的值阴影背景空色。set_caption(caption):设置标题set_na_rep(na_rep) :在样式器上设置丢失的数据表示形式。set_precision(precision) :设置精度(精度)set_properties([subset]) :Method to set one or more non-data dependent properties or each cell.set_table_styles(table_styles) : Set the table styles on a Styler.to_excel(excel_writer[, sheet_name, na_rep, …]) :Write Styler to an Excel sheet.use(styles) : Set the styles on the current Styler.where(cond, value[, other, subset]) : Apply a function elementwise.
案例
一:
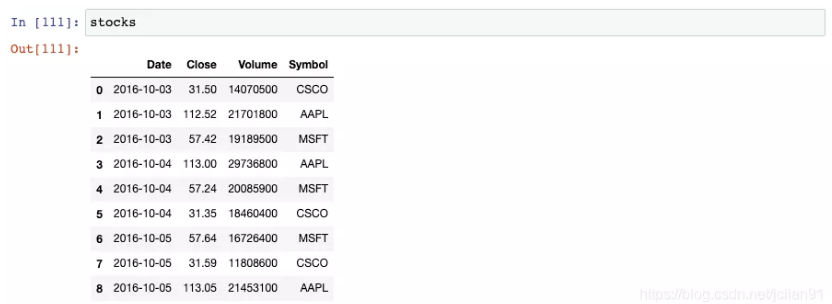
我们可以创建一个格式化字符串的字典,用于对每一列进行格式化。然后将其传递给DataFrame的 style.format()函数:

注意到,Date列是month-day-year的格式,Close列包含一个$符号,Volume列包含逗号。
我们可以通过链式调用函数来应用更多的格式化:
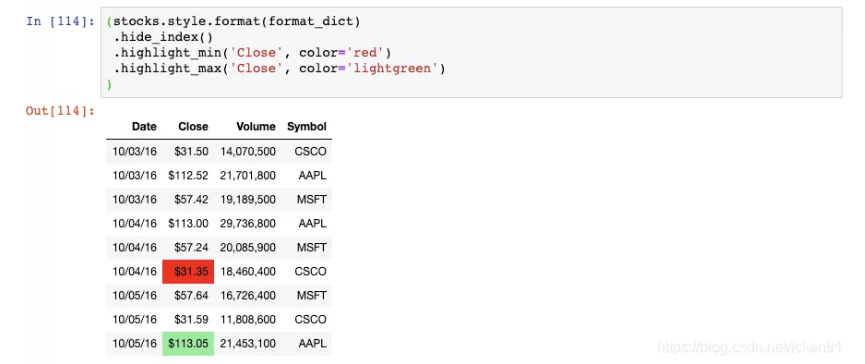
我们现在隐藏了索引,将Close列中的最小值高亮成红色,将Close列中的最大值高亮成浅绿色。
这里有另一个DataFrame格式化的例子:

Volume列现在有一个渐变的背景色,你可以轻松地识别出大的和小的数值。
最后一个例子:
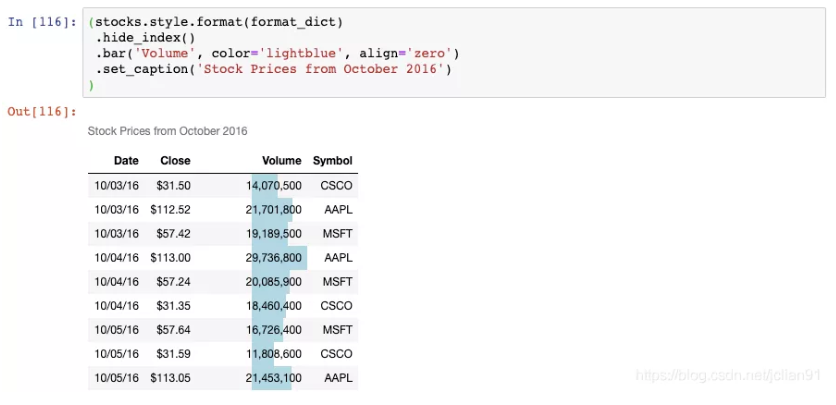
现在,Volumn列上有一个条形图,DataFrame上有一个标题。
二:
表格样式创建
表格视觉样式:Dataframe.style → 返回pandas.Styler对象的属性,具有格式化和显示Dataframe的有用方法
样式创建: ① Styler.applymap:elementwise → 按元素方式处理Dataframe ② Styler.apply:column- / row- / table-wise → 按行/列处理Dataframe
import numpy as np
import pandas as pd
import matplotlib.pyplot as plt
%matplotlib inline
# 样式
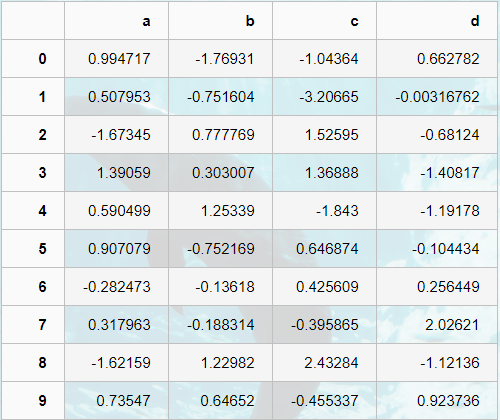
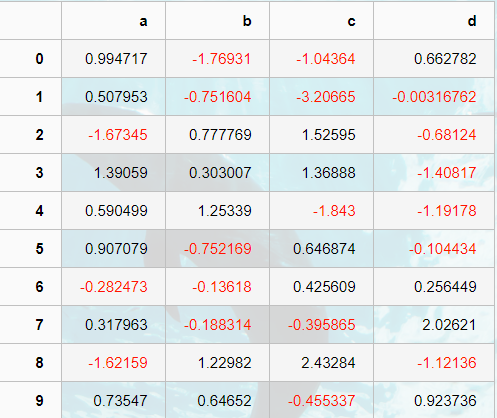
df = pd.DataFrame(np.random.randn(10,4),columns=['a','b','c','d'])
sty = df.style
print(sty,type(sty))
# 查看样式类型
sty
# 显示样式
# 按元素处理样式:style.applymap()

def color_neg_red(val):
    if val < 0:
        color = 'red'
    else:
        color = 'black'
    return('color:%s' % color)
df.style.applymap(color_neg_red)

# 创建样式方法,使得小于0的数变成红色
# style.applymap() → 自动调用其中的函数
# 按行/列处理样式:style.apply()

def highlight_max(s):
    is_max = s == s.max()
    #print(is_max) # 布尔型索引
    lst = []
    for v in is_max:
        if v:
            lst.append('background-color: yellow')
        else:
            lst.append('')
    return(lst)
df.style.apply(highlight_max, axis = 0, subset = ['b','c'])
# 创建样式方法,每列最大值填充黄色
# axis:0为列,1为行,默认为0
# subset:索引
# 样式索引、切片

df.style.apply(highlight_max, axis = 1,
               subset = pd.IndexSlice[2:5,['b', 'd']])
# 通过pd.IndexSlice[]调用切片
# 也可:df[2:5].style.apply(highlight_max, subset = ['b', 'd']) → 先索引行再做样式

参考